

The Teacher Tapp user count keeps on growing! This week we edged over the 1350 users mark.
Please keep sharing what we are doing with colleagues so they can sign up too. We’ve a powerpoint slide (with script), a PDF, and a black-and-white one pager (because we care about photocopying budgets!)
Also we launched our ADVENT CALENDAR BOOK GIVEAWAY! ??
Every question you answer this month gives you a raffle ticket in our education books giveaway at the end of the month, with goodies provided by Bloomsbury and John Catt. The more questions you answer, the more chance you have to win!
Right, onto the findings:
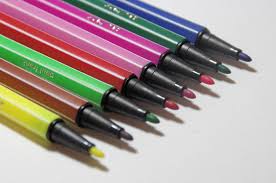
1. Marking pens – what colour are yours?
This one caused a heap of debate on twitter! An Essex teacher asked if we could find out if most teachers are required to mark in a specified pen colour.
And it’s true! A remarkable 65% of teachers are told what colour pen to mark in.

Through your tweeting we learned of some interesting policies. For example, one school had children write in black, mark their own work in red, and then teachers marked in green. (This might explain the popularity of green – 21%).
Another told us their policy is green for teachers, purple for self/peer marking and aqua for marking by learning support assistants. AQUA! Where do you even buy those?
Surprisingly, many teachers were positive about the approach, saying it helped reduce confusion for pupils and for staff. Others felt it diminished teacher autonomy just a tad too far.
2. Is Ofsted “reliable and trusted”?
We did a cheeky thing this week.
First, we asked Teacher Tappers if they thought Ofsted acts as a “reliable and trusted arbiter”.
Only 16% of teachers even agreed that Ofsted is “reliable and trusted” at judging standards. That’s a really low score!

Yet when we asked if you users agreed with the Ofsted rating of their own school, the picture switched around! ?

Although only 16% of teachers think Ofsted is reliable and trustworthy, a stonking 57% trust the grade for their own school! What’s going on? ?
This reminds of the old NHS statistics, in which people would routinely say the service overall was rubbish but their personal experiences were always rated very highly. Could it be that an overall delusion about Ofsted’s competence has been created?
One tweeter, @MrRissbrook, pointed out that if the odds of a rating being thought of as reliable is only 57%, then once you’ve worked across 3 schools the likelihood of you agreeing in all 3 drops to 18.5%.
So we wondered: does the number of Ofsted inspections in your career affect your view of the inspectorate?
And yes, it does!
As people go through more Ofsteds, they become more cynical about its reliability and trustworthiness.

We also suspected that people’s views on their current schools’ grading might change depending on the positivity of the outcome. After all, if your school is rated ‘good’ then why would you be mad and think Ofsted is untrustworthy?
So we looked, and…

… as expected, teachers in schools with lower grades (3 and 4) were the least likely to say ‘yes’ their Ofsted was roughly accurate.
BUT: do you see the quirk?
A whopping 24% of teachers in Outstanding schools think their grade overstates the quality of education provided.
This should concern Ofsted. And it’s unsurprising that Amanda Spielman, the chief inspector, has hinted she wants to look again at the policy of letting Outstanding-rated schools go without inspection until someone flags a major concern. If this is anything to go by, concerns already exist in around 20% of those schools! ?
3. Teachers are losing their religion
In the past, Becky has studied the religious background of pupils who attend Church schools, but she hasn’t seen anyone explore the staff who work there. So last week we asked a range of questions on religiosity in order to understand you better.
What we have seen is a huge decline in religion across England – 62% of teachers now say they have no religion.
We wondered if this was a change from when people grew up; so we asked teachers to tell us their religion today and the religion they were raised in.
What the chart shows is a substantial loss of Anglican identification. Of the people who are not religious today (the top bar), around 20% were raised Anglican (represented by the purple part of the bar). Lapsed Catholics count for less than 10%.

Another metric used to measure religion is church attendance. It helps see if self-reported religion is carried out in daily life.
Loads of people who say they are religious don’t really bother going to church! Across Anglican, Catholic, and ‘other Christian’ groups, around 20% of attend church less than once or twice a year!

In Anglican and other Christian schools, the majority of teachers are NOT RELIGIOUS.
Catholic schools are doing slightly better but only 42% of their teachers are Catholic… a huge change within a generation.

The Catholic Education Service state that 51% of teachers in their schools are Catholic. It is still a requirement for some senior positions (eg the headteacher), which may mean the numbers are boosted when taking into account more leaders. (Most of our users are classroom teachers). A dropping percentage of Catholics among the teaching population will, however, make this requirement more difficult in future.
4. Charisma and affability
Psychologists have developed six question to measure someone’s charisma and affability.
Becky was particularly interested in the questions because teachers are performers so she guessed they would score highly.
Aaaand… they have!

But why? Does your score grow partly because you are teacher? (We’re just speculating here).
After asking the six questions, we gathered together the answers for each user into a ‘general score’. 24 is the maximum mark – meaning you ‘strongly agreed’ across all the questions. 10 was the lowest score for anyone.
So, who are the least charismatic and affable teachers? Science ones! (Sorry guys)

Given teaching involves so many of the skills asked about, this leads to hard questions for science recruitment and retention. If science teachers are finding getting along with people and leading a group more difficult, then it is likely they will face burn-out sooner than others.
5. Back to the (education policy) future
For fun, we decided to ask if there were any abandoned education policies you would like exhumed. Suggestions came from a variety of places.

It seems the education policy bin is full of ideas that died for a reason! National strategies, KS3 SATs, assisted places: all were given the thumbs down by around 90% of you.
Free milk and contextual value added performance tables got the highest scores – but even those failed to win over most of you! Guess the government will just need to make some new mistakes instead in future.
6. As ever, we know you love the tips. Thanks for all your tweets and sharing. Here’s the links for this week’s selection:
School governors
Textbooks
Bias in observation outcomes
Three types of homework
Reviews as a starter
Facebook ‘shadow’ information
7. Finally, if you would like to suggest a question GO HERE!
Our survey gizmo is easy to fill in and you might feature in a Teacher Tapp question soon

Riiiight, we are done for this week. Time for Christmas shopping!
PS – If you want a cool data-nerd read on Christmas presents you can fill your sack with this. Apparently 4 in 10 people in the UK are planning to buy wireless headphones as presents. Not that we wanted to spoil the surprise for you or anything… ?
**
Enjoyed this post and want to join our Teacher Tapp panel?
Sign up via the iPhone App Store or the Android App Store.
You can also check out more at www.teachertapp.co.uk
**


