


This temperature is better, isn’t it? Hope you’re not camping…
RIGHT! This week we’ve looked at disappearing jobs, teacher pay, lumpy living costs, and the 5% of secondary schools that do seating plans by gender (whhhaaat?!) Read on for the results….
1.What happens if teaching disappears?
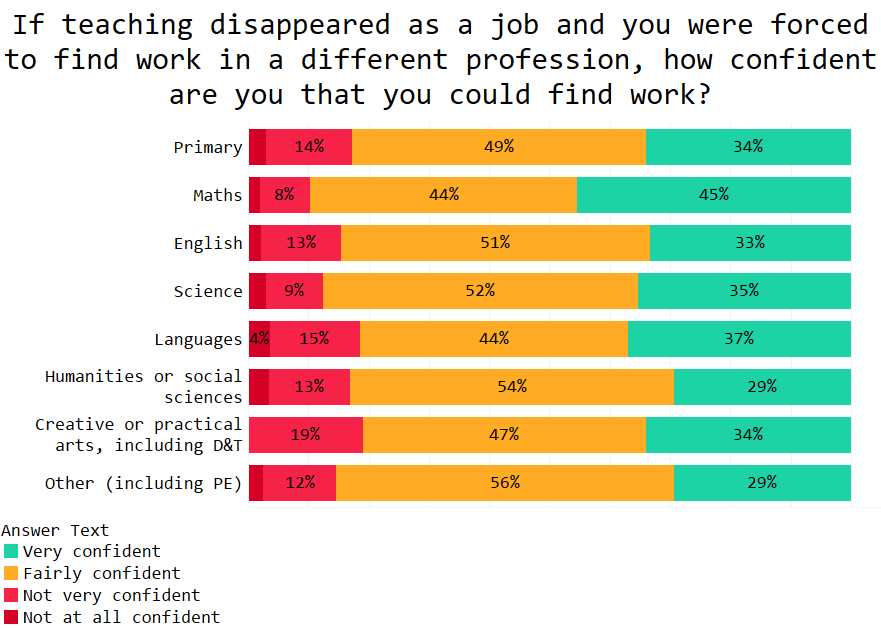
One reason why teachers leave is because they have lots of knowledge that’s useful elsewhere. Which is probably why 1 in 3 teachers felt very confident they could find work in another profession.
That confidence is fairly static across all ages, with only a slightly difference among teachers in their 50s and 60s.

teachertapp.co.uk
Maths and science teachers are thought to be the most employable outside of schools. Maths teachers showed the most confidence, but science teachers were surprisingly low. (Although the number of science jobs available in industry is often disputed so perhaps they are right).
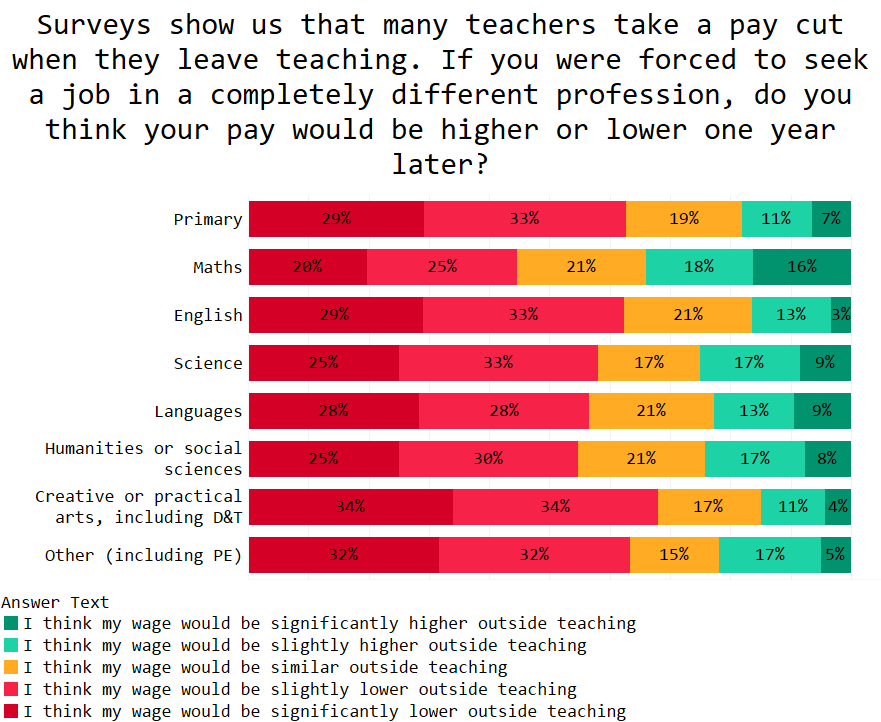
But how well would your wages hold up if you left to do another job? On average, a physics teacher who does another job will earning around £6,500. But PE teachers lose around £8,000.
Teachers seem to be aware of their different market value. Science and maths teachers were more confident they could command higher wages, whereas teachers in creative arts and other (including PE) were less optimistic.
We also found that younger teachers were more optimistic about getting a higher paid job outside of school compared to their older colleagues. Perhaps this is another reason why so many new graduates leave within five years of joining.
One final thought: research by think-and-action tank LKMCo found that a major attraction of teaching is the chance to use the subject a person studies at university.
When teachers think of attractive alternative jobs, they tend to say those jobs would use their degree subject less than teaching. Hence, this may be the reason they didn’t go for the alternative job.
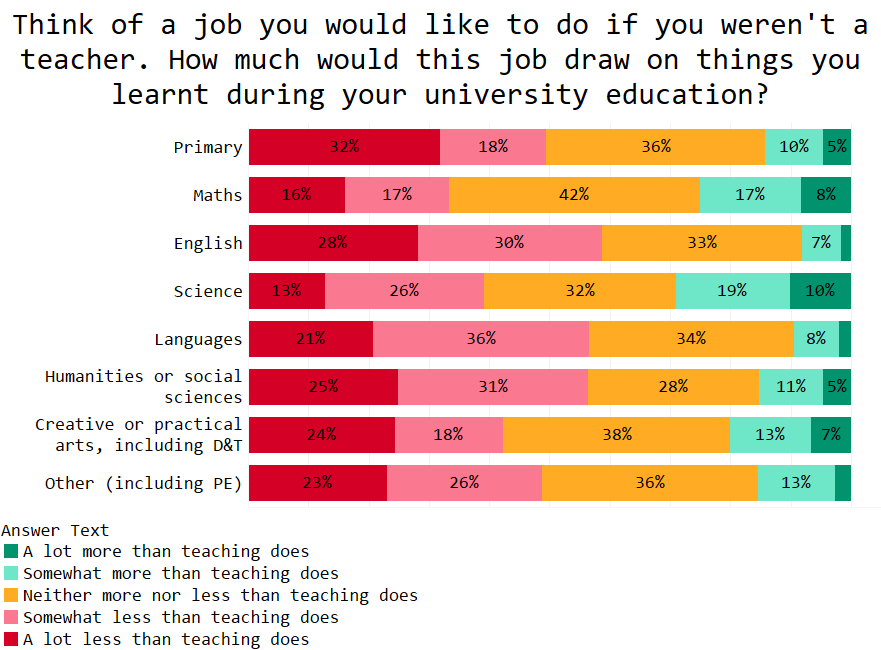
Note who the two stand-out groups are, however. Both maths and science teachers say their preferred alternative job would draw more on their subject knowledge. This is interesting. It’s often assumed that money is the draw for science and maths teachers to other jobs. But maybe it’s the ability to do more science or maths. If so, a model like the Researchers in Schools programme – which provides time each week to undertake academic research – would help retain this group in schools. One to consider!
2.Exclusions: who has the last word?
The Education Select Committee this week put out a report on exclusions. Robert Halfon, the MP who chairs the committee, was dismayed to learn that a boy in his constituency was permanently excluded from school and the exclusion stood even when the independent appeal board found against it. (Because headteachers have ultimate power).
Halfon has since pushed for reform, including a charter which guarantees children the right to stay in school if an appeals board finds in their favour.
Teachers do not favour Halfon’s approach.
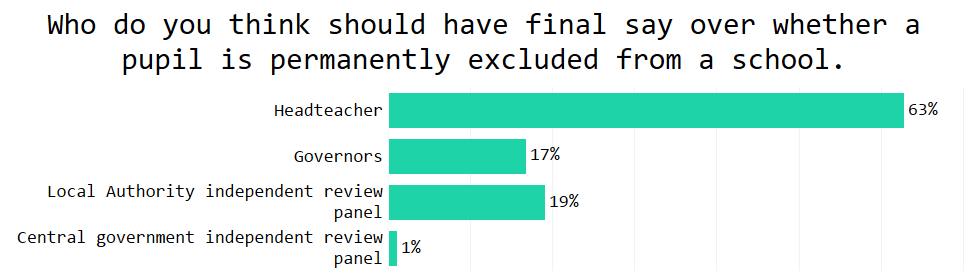
Teachers across all job roles felt the headteacher should be the ulimate arbiter, except for headteachers themselves who supported governors as being the people who should make the final final choice.
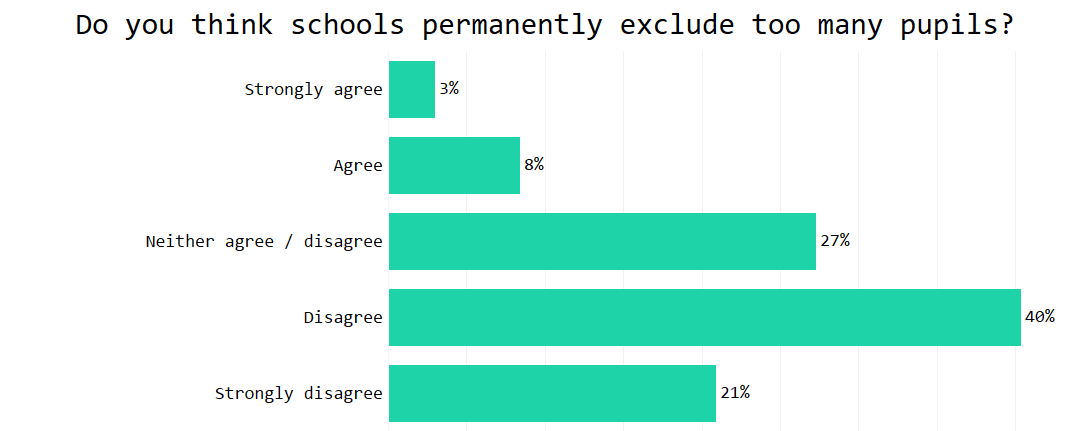
The teacher panel also didn’t feel too many pupils are permanently excluded.
Given the panel is often fairly progressive and left-wing, it suggests there is broad support for exclusions across the profession.
Part of the discussion over the last week on exclusion has focused on the difficulty of pupils whose families are experiencing high levels of poverty and/or disruptive challenges. We looked at opinions across primary with low free-school meal intakes (1) to those with high free meal intakes (5).
It’s not obvious by sight what the patterns are and we would need to run some significance testing to see if it’s more than random variation. But here’s what we found.

If you spot a pattern you think it’s worth us investigating, let us know.
3.Schools in poorer areas deliver free breakfasts
Last week, 130 parents queued from early in the morning to get their child into a free breakfast club at a school in Cardiff. But how common are such clubs in England?
19% of schools run a breakfast club that gave free meals to some pupils and 12% run a club that is free for all pupils.
Furthermore, it looks like schools with the highest concentrations of poorer pupils are the most likely to offer a completely free club.
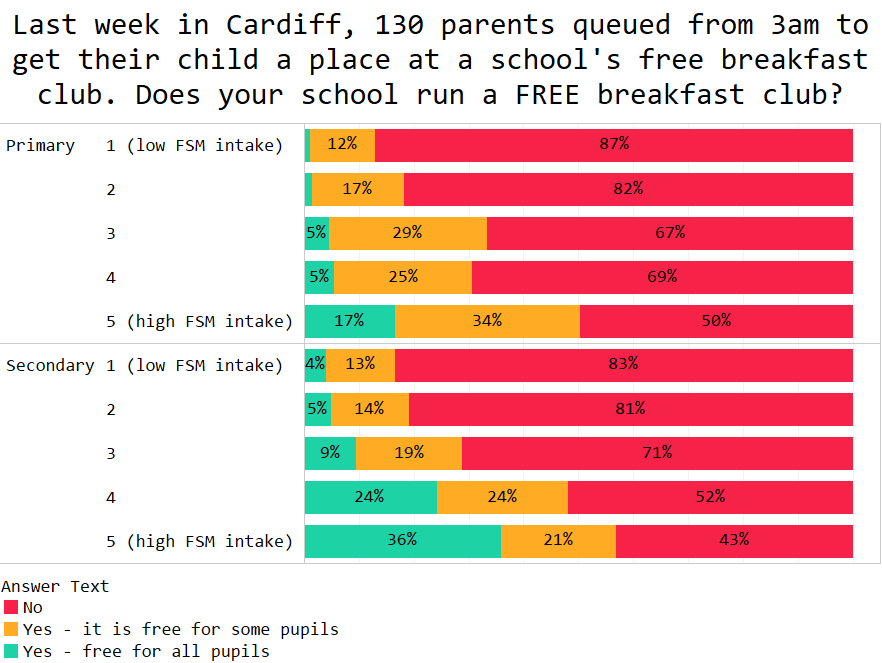
Should one celebrate the fact that 1 in 3 secondary schools in the most deprived areas offer a completely free breakfast club? It feels instinctively better to celebrate that no one needs free breakfast. But, given this is where we are, it’s great that so many schools are making sure that so many children get TWO meals each day.
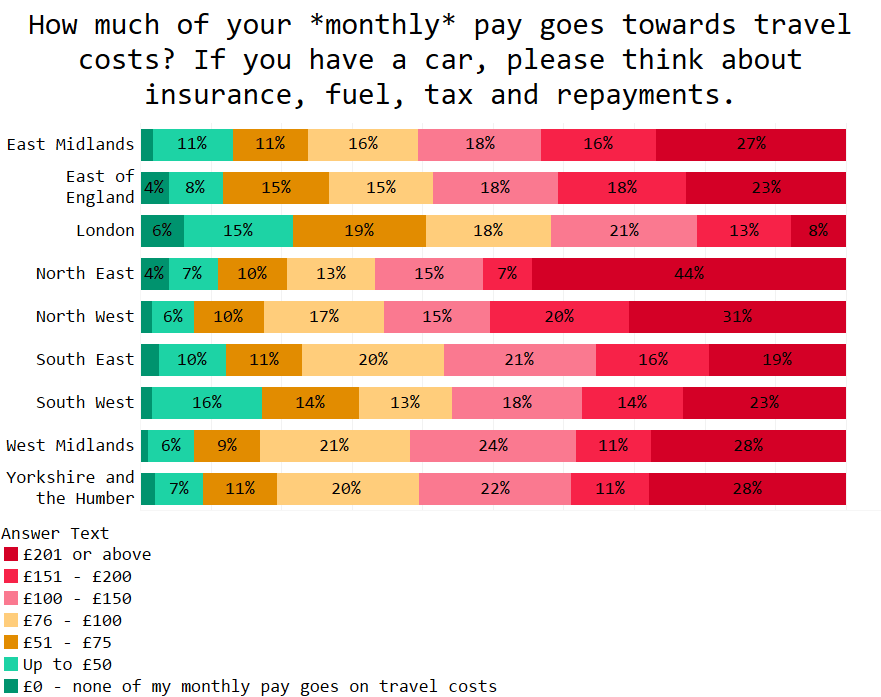
4. The Living Costs Of Teachers
Outside of the inner/outer London pay range, all teachers are paid the same. But living costs are lumpy.
For example, 15% of South West teacher pay over £1,000 a month towards their mortgage or rent. In Yorkshire & the Humber only 5% do.
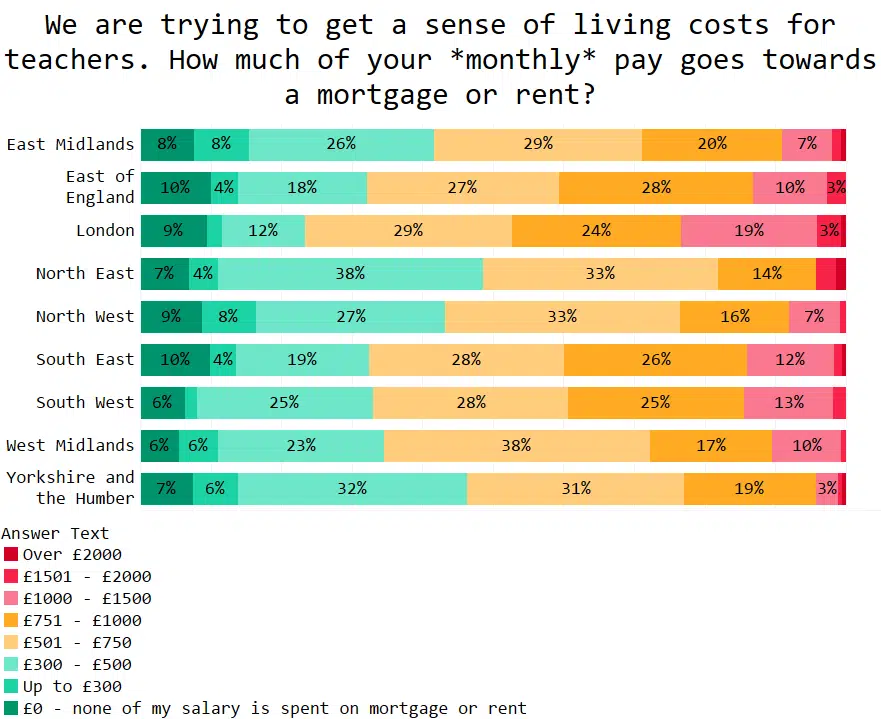
Furthermore, while fewer London teachers can take advantage of low rents – the proportion of teachers paying within the £751 – £1000 range is similar to several other areas. Around a quarter of teachers in the east of England, the South West, or South East are paying £750 – £1000 on rent per month. This quarter are paid less than the quarter of teachers in London who are also shelling out a similar amount.
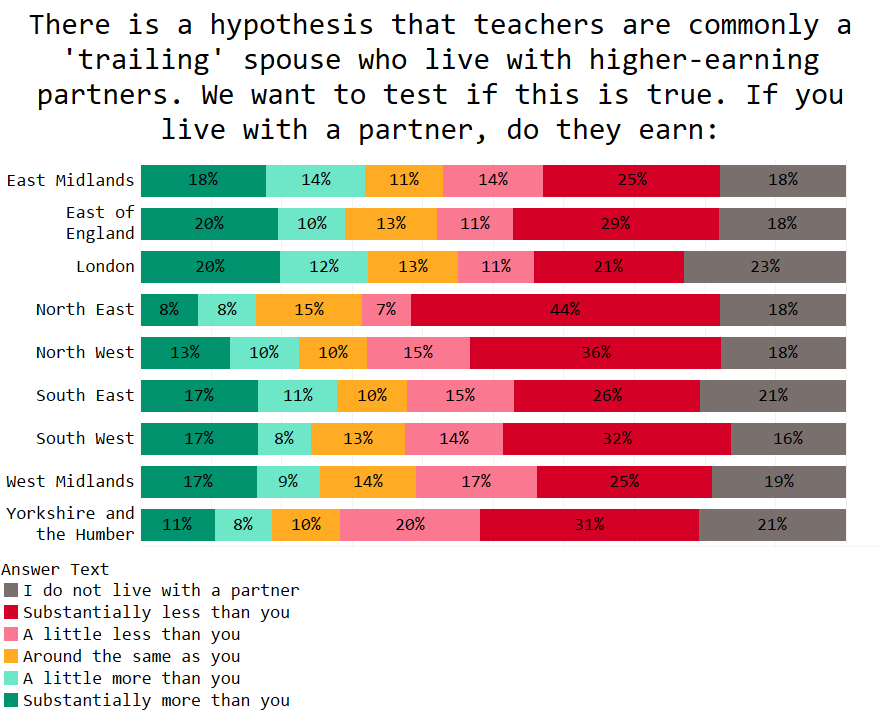
London teachers also have another bonus. If they have a partner, they are likely to earn much more compared to teacher’s partners in other parts of the country. Only 21% of teachers in London have a partner who earns substantially less than them; in the North East 44% of teachers have a partner who earns substantially less.
Finally, teachers in London schools spend the least amount on travel per month. Tube tickets can seem expensive on a day-to-day basis, but if you factor in the cost of trains elsewhere in the country, or the ever-increasing cost of fuel, car tax, and insurance, London teachers don’t do too badly.
All this said, it appears that London teacher training providers are being struggling this year to fill the courses – which is a worry. Housing costs are high in the capital and there is a perception that living costs are dramatically higher. But these graphs do suggest that living costs are lumpy across the country and that there are several other parts of England which have a claim on expensive housing, but still have the same salary rates as everywhere else. Academies can, of course, flex their pay a little, but given the state of current school budgets that flexibility is limited.
Time for a rethink all round?
5. So, what was the pay rise?
Before the pay rise announcement last week, teachers seemed divided between a 2-3.9% pay rise or one that was above 5%.

Mainscale classroom teachers were the ones most likely to vote for a 5% rise. Headteachers were much more conservative. (Something they may now regret).
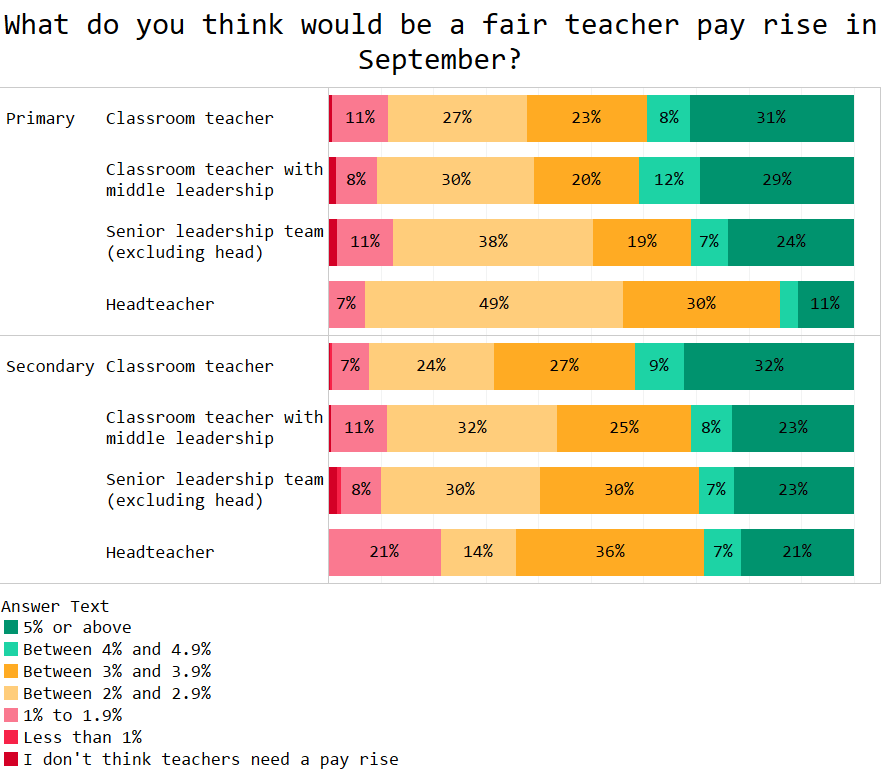
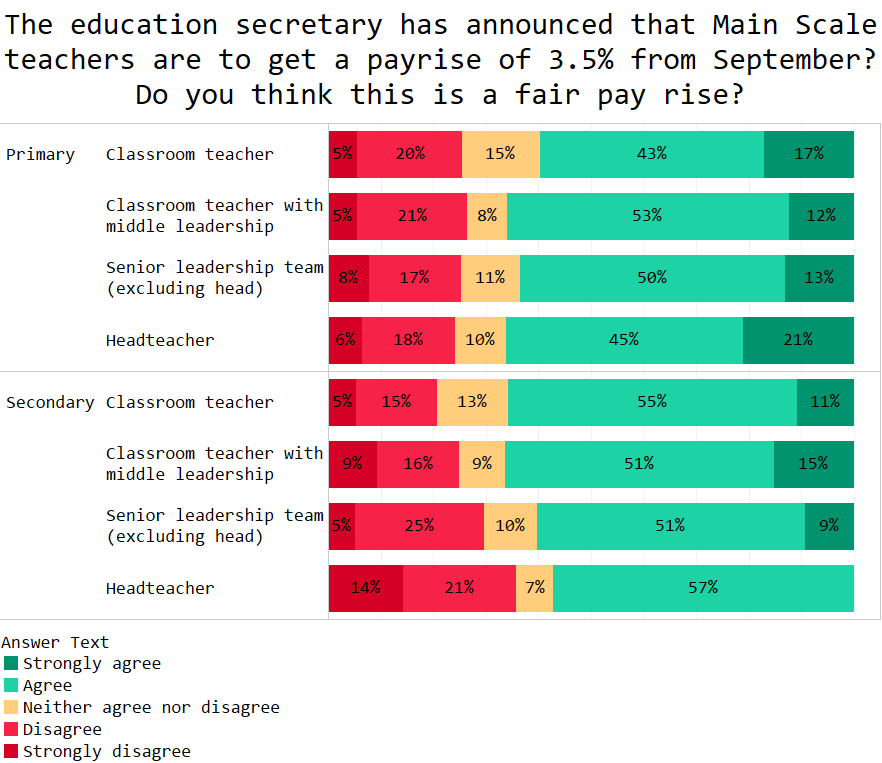
The results came in and mainscale teachers got 3.5%, upper scale got 2%, and senior leaders got 1.5%.
*
Most teachers felt the mainscale pay rise was fair (64%).
However, note the secondary headteachers – none of whom strongly agreed even though 34% of them had picked this range in the prior question.
Teachers were more annoyed by the upper pay scale – 60% disagreed that it was fair.
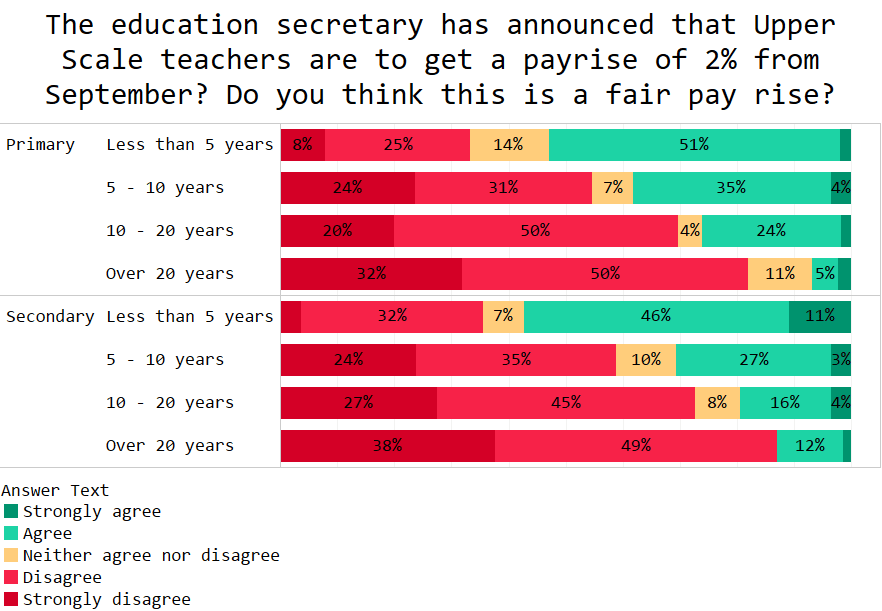
Predictably, the longer someone had been in the profession (and so was more likely to be on the upper pay scale), the more they disagreed.
There was similar outrage over the senior leader rise – with 58% disagreeing it was fair.

Again, the headteachers show a quirk. 21% of headteachers had previously said they felt a pay rise in the range of 1 – 1.9% was fair. However, after the announcement, only 14% agreed with the 1.5% rise and no one strongly agreed with it. It seems as if heads were only happy for a 1 – 1.9% rise if it affected everyone.
We have seen before that teachers are very wedded to notions of equal treatment in pay. This makes it very difficult for the government to address issues like those in the prior section around differing costs of living, or to deal with the fact that younger people are more commonly facing higher mortgage costs than those who have been in the profession some time.
6. 5% of secondary schools use boy-girl seating plans
This finding has blown our minds: 5% of secondary schools require teachers to sit children in gender-based seating plans.
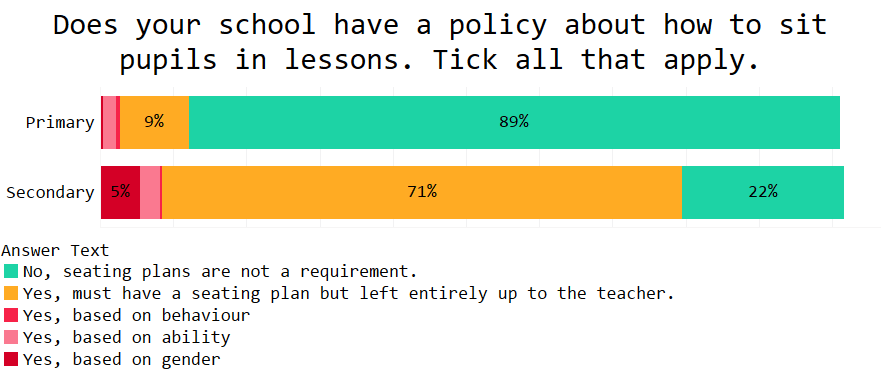
Does anyone know why?!
**
7. Finally, as ever, we learned that you really love our daily tips, so here are the links for last week:
Generic domain-specific skills do not exist
Summit Fever: Be Careful What You Wish For
John Hattie is wrong for the right reasons
SATs: how to reduce the pressure
The teacher pay deal: Full details
*
Right folks – over and out for another week…
In the meantime, keep sharing what we are doing. Here’s a powerpoint slide (with script), a PDF, and a black-and-white one-pager to help.
Remember, we need more of you before we can do the really exciting and detailed analysis!
Enjoyed this post and want to join our Teacher Tapp panel?
Sign up via the iPhone App Store or the Android App Store.
You can also check out more at www.teachertapp.co.uk


