Folks! We broke the 1,600 users barrier this week.
Many thanks to teachers attending the Chartered Teacher pilot launch who signed up and are nudging colleagues to join in.
Also: we discovered a new benefit of Teacher Tapp
I love @TeacherTapp for many reasons, not least because at the weekend the 3:30pm notification alerts me that I’m wasting the day
— Clare Sealy (@ClareSealy) January 21, 2018
Teacher Tapp: Keeping you proactive since 2017!
In the background, we are also making changes to the ap to enable quicker and better analysis. It will make weekly blogs even more insightful and beautiful too.
This week, however, our graphs are a teachertapp.co.uklittle different. Becky wasn’t around to oversee the analysis, as she was in Amsterdam for ResearchEd, and we were dealing with new systems. SO – beware! – there are a few quirks on the graphs. Bear with us.
Cue a bear gif…
Right, onto this week’s results…
1.Hypothetical Children
A teacher got in touch as she was interested in a recent question asking whether people would send their children to their own school (including hypothetical children).
She wanted to know if the results would vary by Ofsted rating.
So we looked: and yes, teachers are much more likely to say they would send their own child to the school where they teach if that school is good or outstanding.
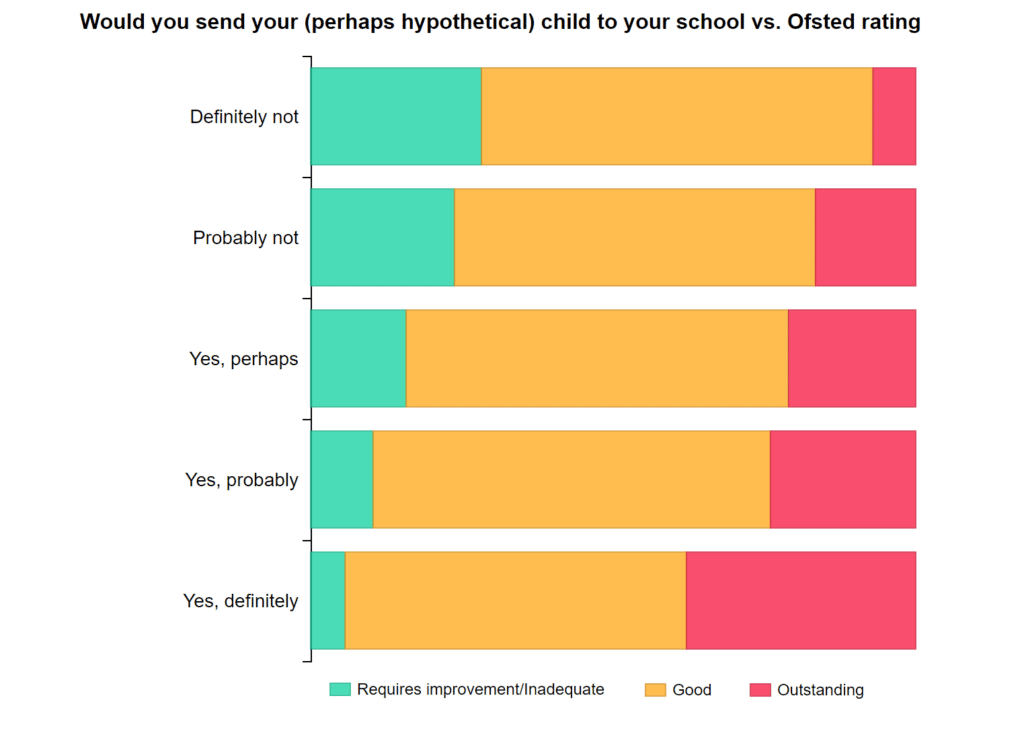
Reds are the outstanding, yellow good, and green is RI/Inadequate (we had to collapse together as there were low numbers of inadequate).
It’s not a surprising finding in itself. It makes sense to want to send your child to a great school. But it’s interesting in the context of our finding from December that only 16% of teachers felt Ofsted was reliable and trustworthy.
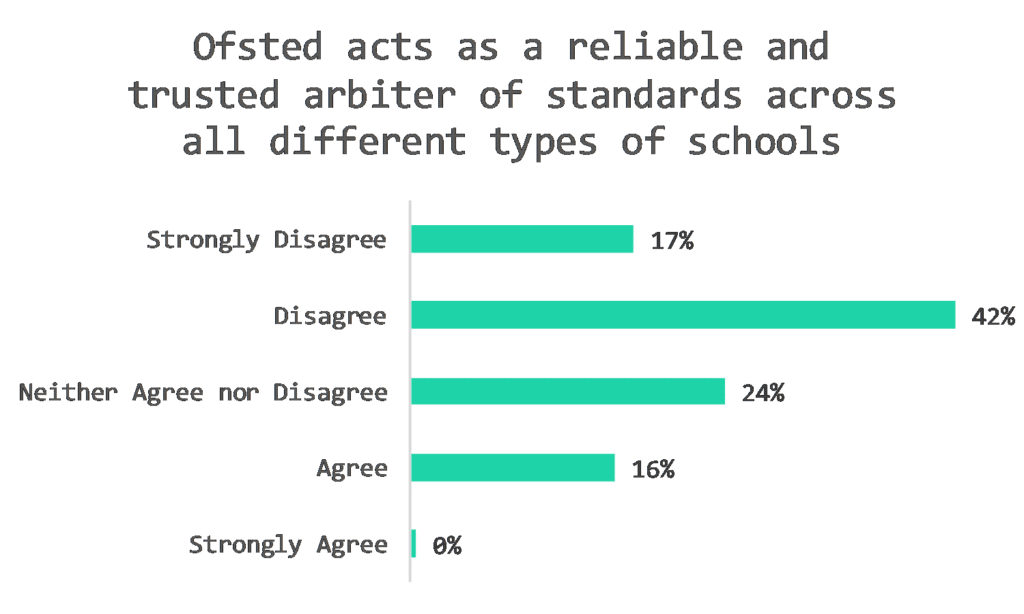
Hence, even though teachers may not find Ofsted reliable and trustworthy, either the inspectorate’s ratings do influence what teachers think about where they send their children, or the ratings do somewhat align with the quality that teachers see in schools.
Of course, the big question is the extent to which Ofsted ratings align with teachers’ perceptions. For example, we know that 22% of teachers in schools with a grade 1 (outstanding) feel the inspectorate “overstates” the quality provided. A teacher could therefore want their child to attend the outstanding school where they teach, but may nevertheless not feel the grading is reliable.
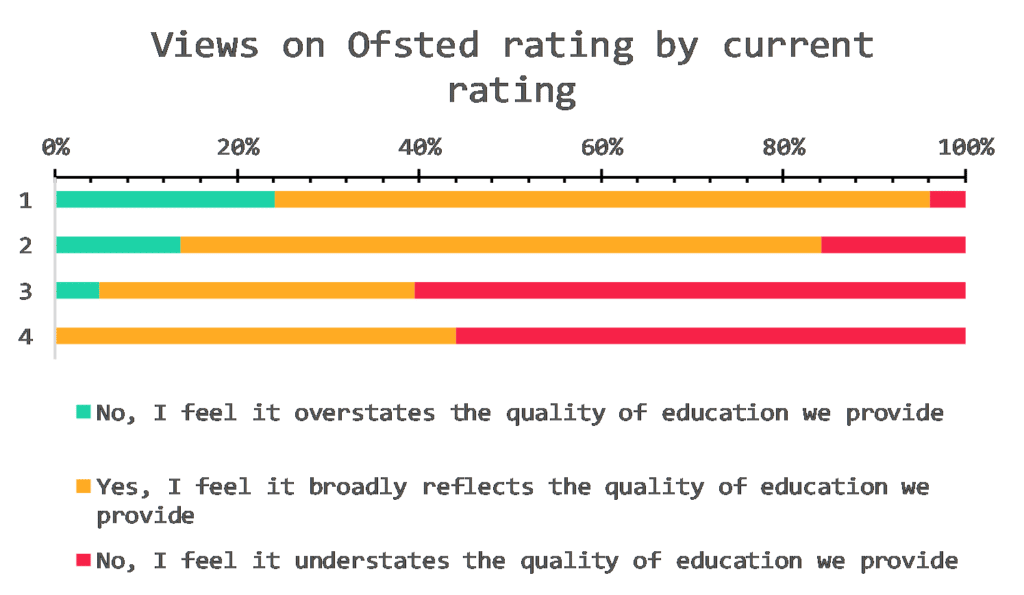
Either way, it’s an interesting point to ponder: how many teachers in your school send their own children there too?
2. The Magic Triad: Autonomy, competence & relatedness
An assumed problem for Teacher Tapp is that we survey people choosing to engage with our questions. Because of that it’s sometimes thought that everyone taking part must be an enthusiastic, positive person. However, the psychological literature suggests that while ‘voicing’ ideas is a sign of engagement, it doesn’t necessarily have to be positive. For example, protests are a form of engaged ‘voice’ but where people are unhappy.
When we asked panellists about their morale before Christmas we found a lot of division among our users:
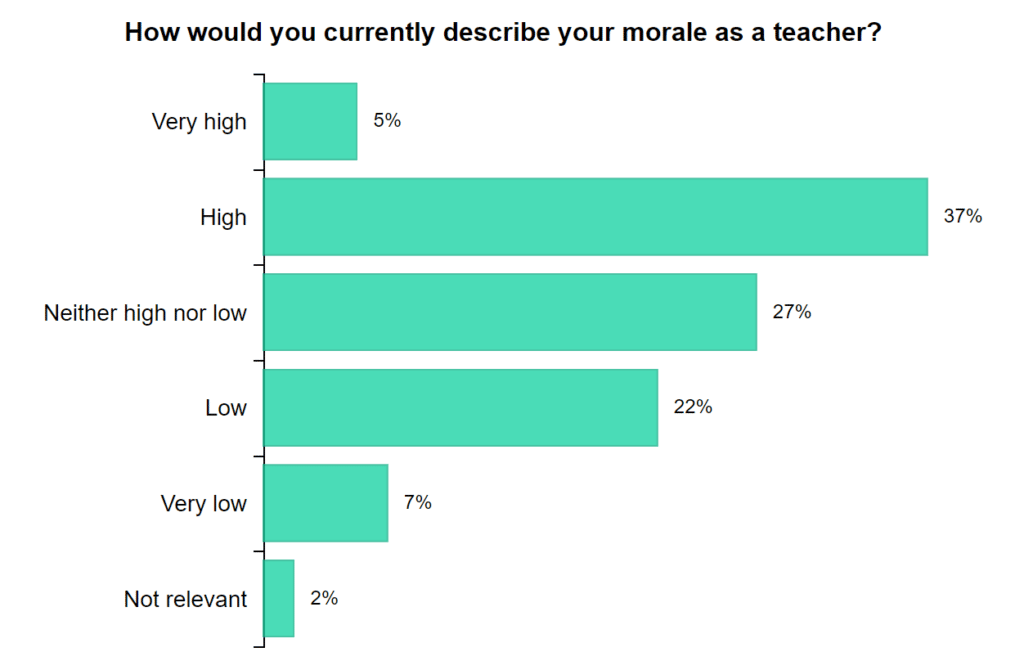
More teachers rated themselves as ‘very low’ morale than ‘very high’ morale, but more teachers were on the ‘high’ scale overall than the ‘low’.
This got us thinking.
One of the most talked about theories in workplace psychology is self-determination theory, which breaks down into three components: autonomy, competence, and relatedness. The hypothesis is that workers who experience all three are typically more satisfied and more likely to stay in their jobs.
Was this also true among our users?
One way of looking at competence is to ask whether a job gives a feeling of achievement.
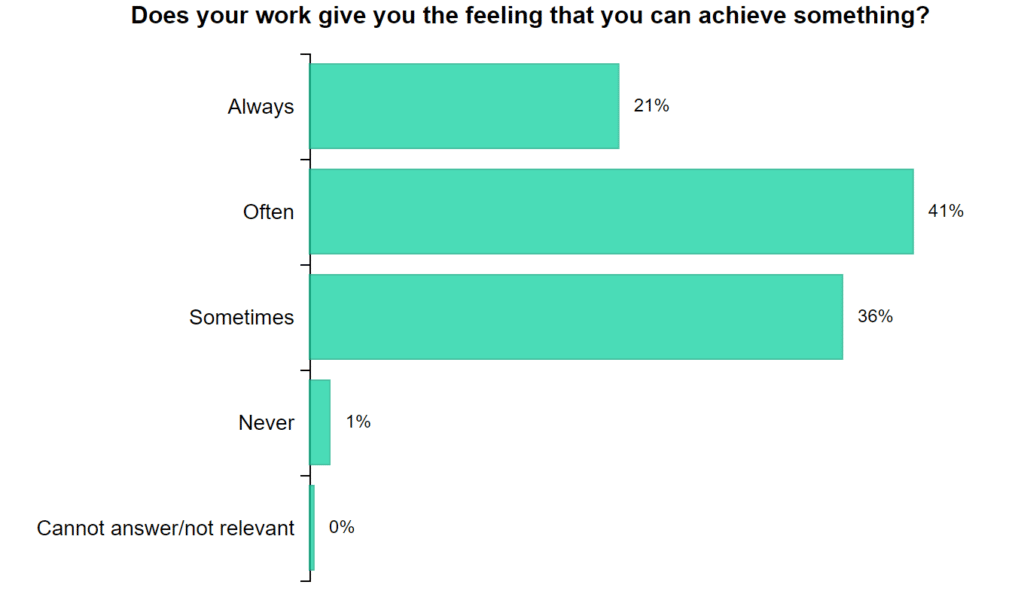
Good news: only 1% of teachers never feel a sense of achievement.
Bad news: 36% only feel a sense of achievement sometimes (as opposed to often or always)
But does this matter? It turns out, it might…
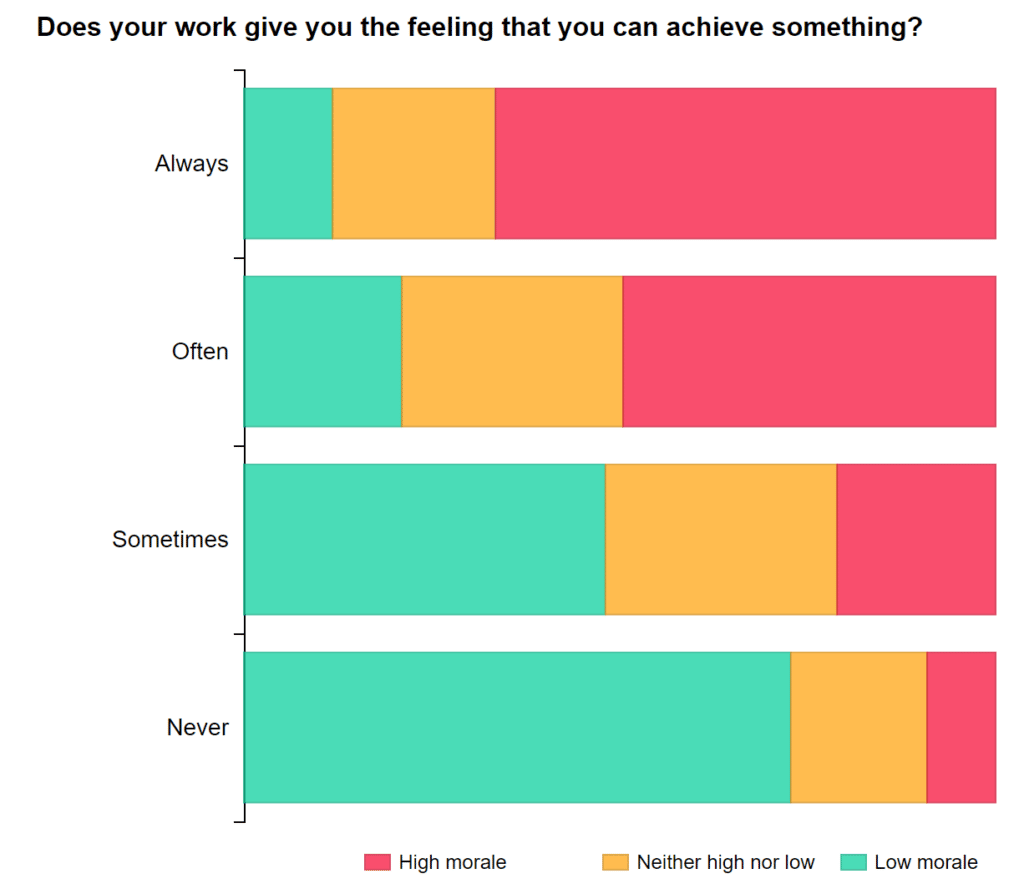
Red shows high morale and mint green shows low morale. High is on the right hand side, low is on the left side.
Teachers who feel they are always achieving report the highest morale.
Teachers who say they never achieve largely have low morale.
Hence, thought for pondering: If you are a line manager or mentor it is worth asking colleagues how often they feel a sense of achievement and seeing what can be done to improve it.
3. Friends are all you need
Keeping with the self-determination theme…
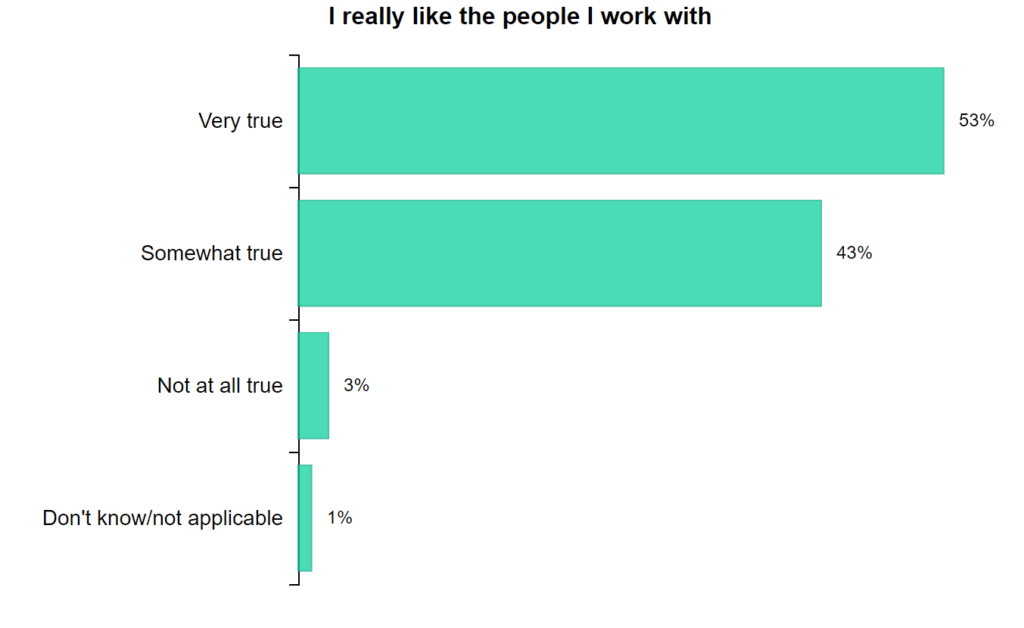
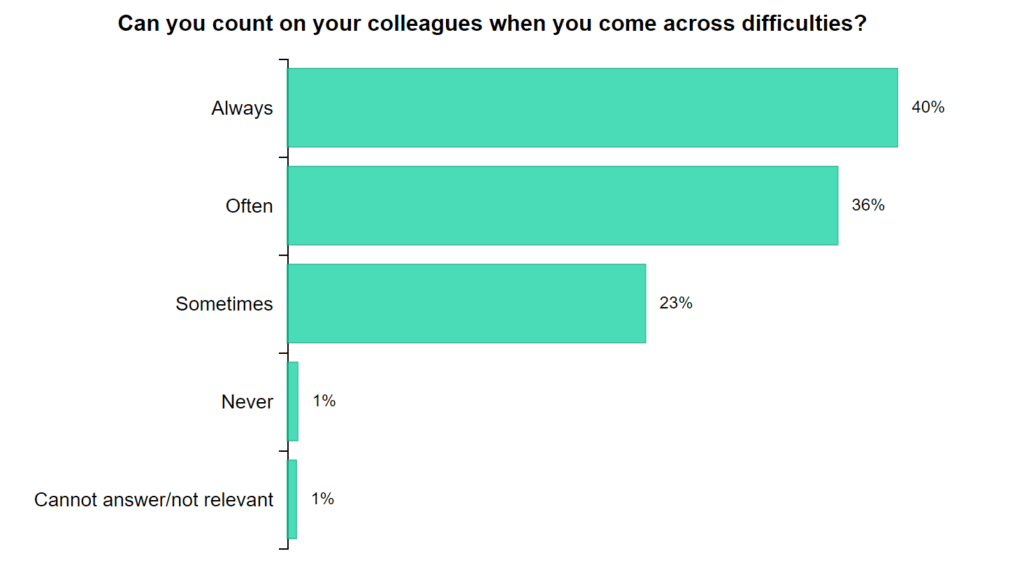
Two questions that show relatedness at work are the extent to which you like the people you work with, and if you can count on colleagues when you’re having deifficulties.
Typically, we found teachers like the people they work with. But they can’t always rely on them in difficulties.
Does this matter? To find out we also asked if people thought they would still be a teacher in 3, 6 and 10 years’ time, and looked at this in relation to answers about colleagues.
Over three years the answer was that it had some influence, but not much. Teachers who didn’t like the people they work with were marginally less likely to say they thought they’d stay in teaching beyond 3 years.
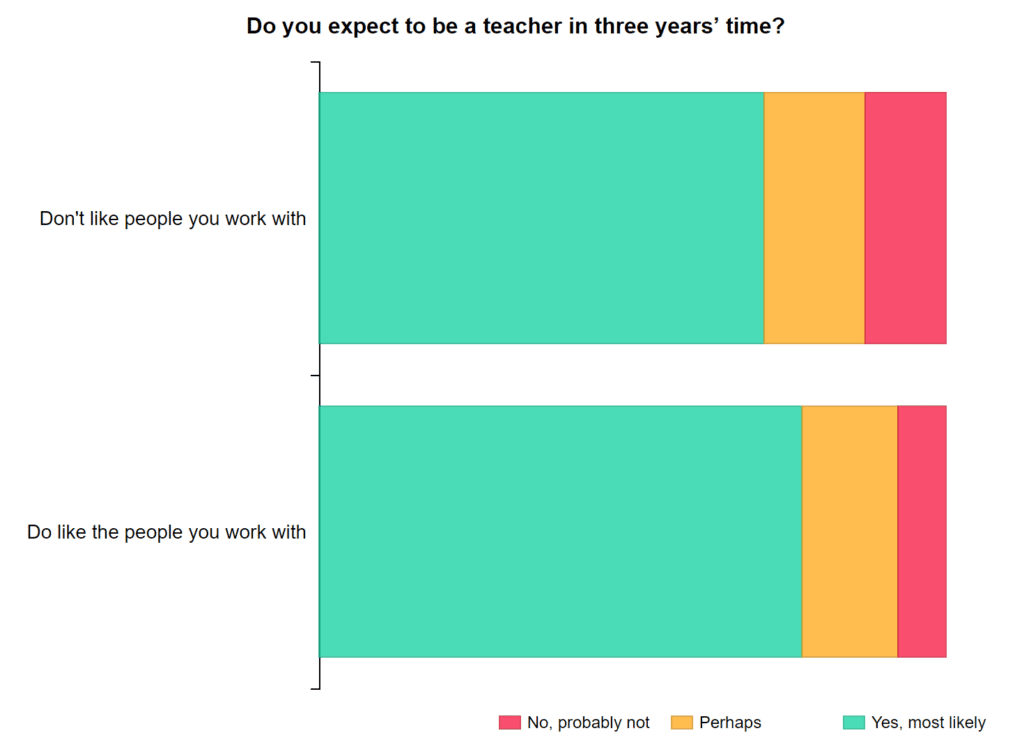
But this influence appears to get greater with time. When a teacher who doesn’t like their colleagues is asked if they will still be teaching in ten years’ time, they are almost evens between ‘no probably not’ and ‘yes most likely’. This is not the case for teachers who say they like their colleagues. They are twice as likely to say ‘yes most likely’ than ‘no, probably not’.
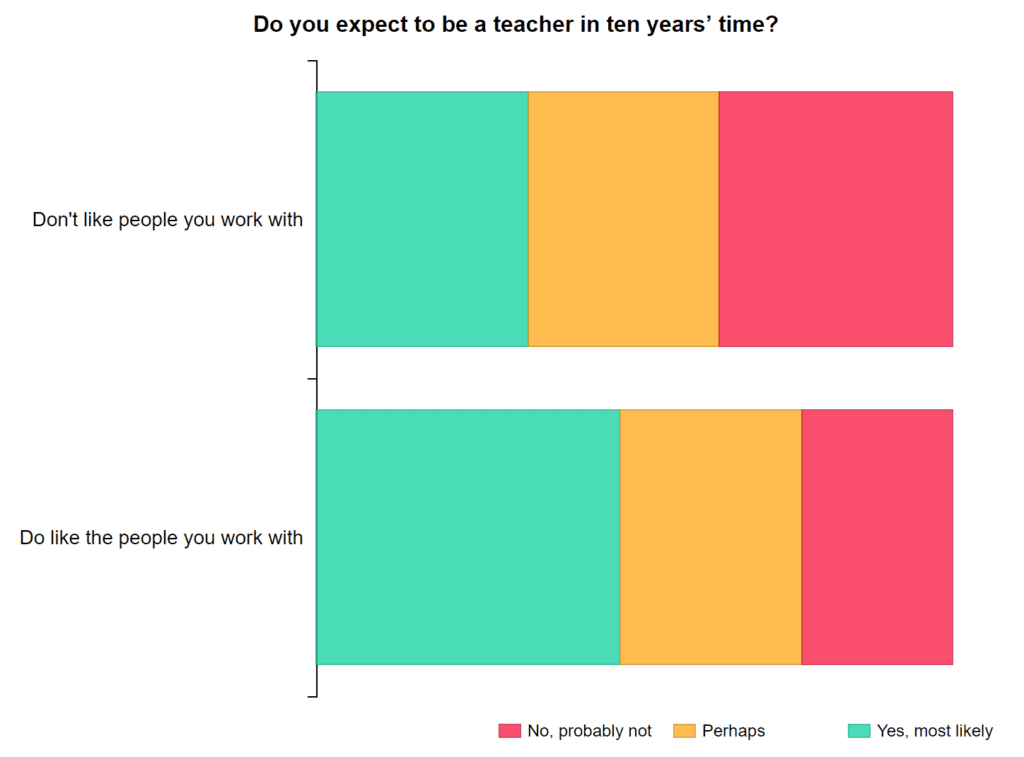
Hence, another thought to ponder: How much do staff like each other in your school? What contributes to this?
4. Headship & Locus of Control
Last Monday our questions were unusual and users were not happy. ?
But we had method in our madness! The Rotter Locus of Control scale, developed in 1966, asks questions designed to see if people believe that what happens to this is mainly a result of ‘internal’ or ‘external’ actions. Or, to put it another way, to what extent does ‘luck’ matter.
To do this, users had to pick between one of two options. It was a forced choice and no ‘can’t answer’ option. We know this gets on people’s nerves, but it’s faithful to the original survey so we thought we’d try it. (Don’t worry; we’ve got the message not to do it too often!)
On the first two Rotter questions, teachers split around 40:60, with 40% believing luck matters, and 60% thinking it was one’s own actions that matter.
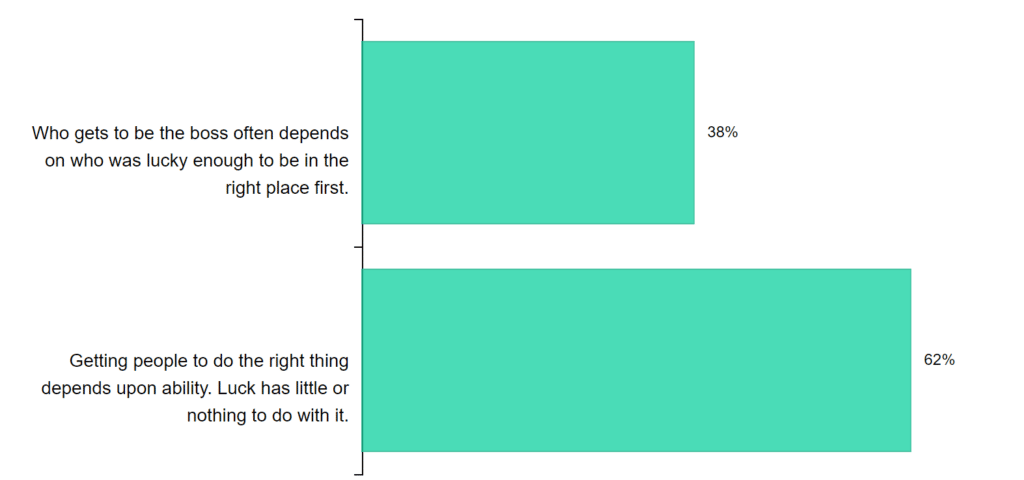
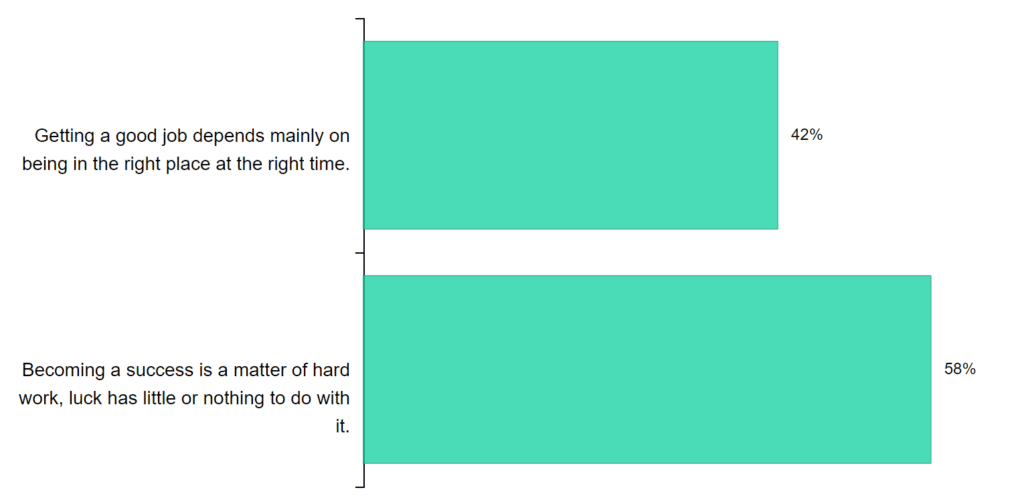
On a third question, however, people were divided.
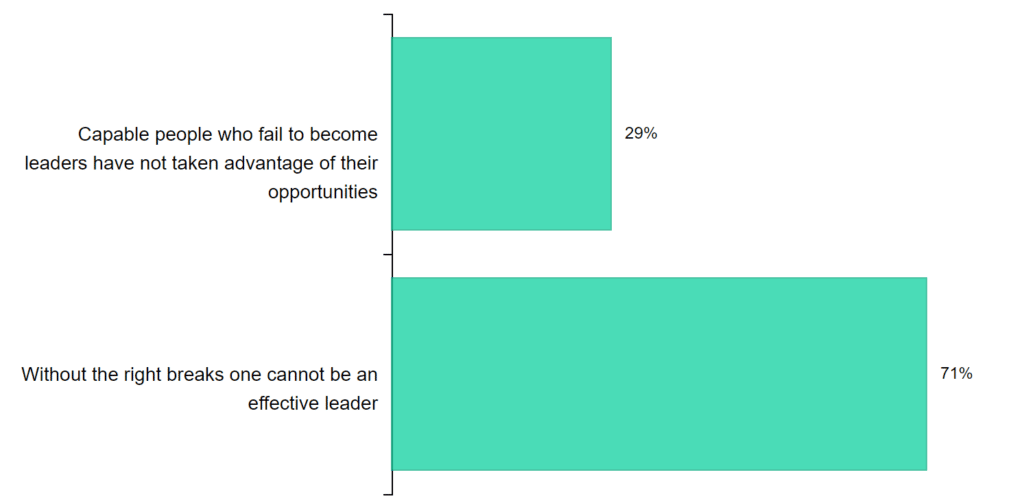
Now, this could be because some people thought ‘right breaks’ meant ‘an adequate amount of holiday’ rather than its original meaning of ‘lucky breaks’. It might also be because this final question asked specifically about becoming a leader. Perhaps people felt that while generally one’s own actions matter most, when it comes to leadership roles specifically then luck plays a big part.
Headteachers, however, were the least likely to think luck matters and most likely to think capable people who don’t become leaders simply didn’t take the opportunity.
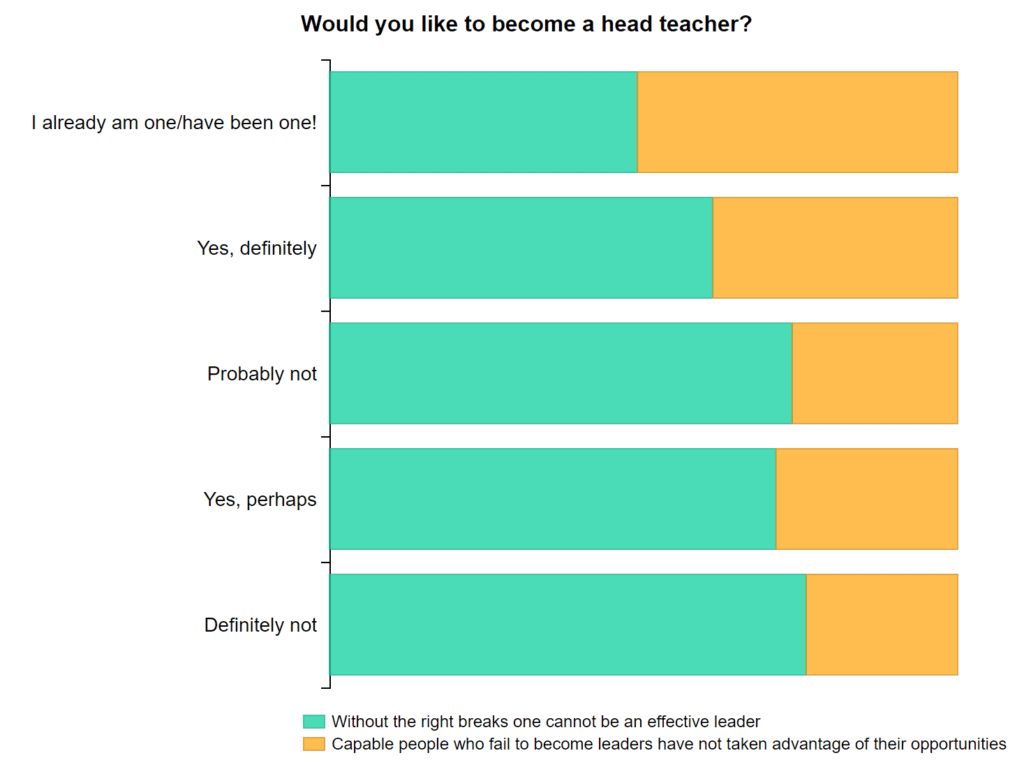
Meanwhile, teachers who said they did not want to be a headteacher tended to believe more in luck (as represented by the green on the left).
At this stage, these are tentative explorations into locus of control. There are more questions and more interesting analyses to do. One of the reasons we are doing background working is so that we can start to do better analysis and to see if these are all coincidences or if a picture is gradually building up of real working life.
But the topics of luck, locus of control and leadership are interesting to think about. There’s lots of psychological studies but John Tomsett’s brilliant blog on the importance of luck, and how he uses its power to help students, is a great one to share before wading into the mire. It also has a great idea for an assembly in it!
5. Pay & Morale
Finally, we asked a question last week on pay. We’ve been a bit cautious of pressing on this topic but it’s important.
A common trope in education policy at present is that pay doesn’t matter. Because most people leaving the profession go into jobs that pay less, the theory is that pay is not the problem.
However, we don’t know if this is true for all groups. Blanket statistics don’t help. Take our finding this week for example:
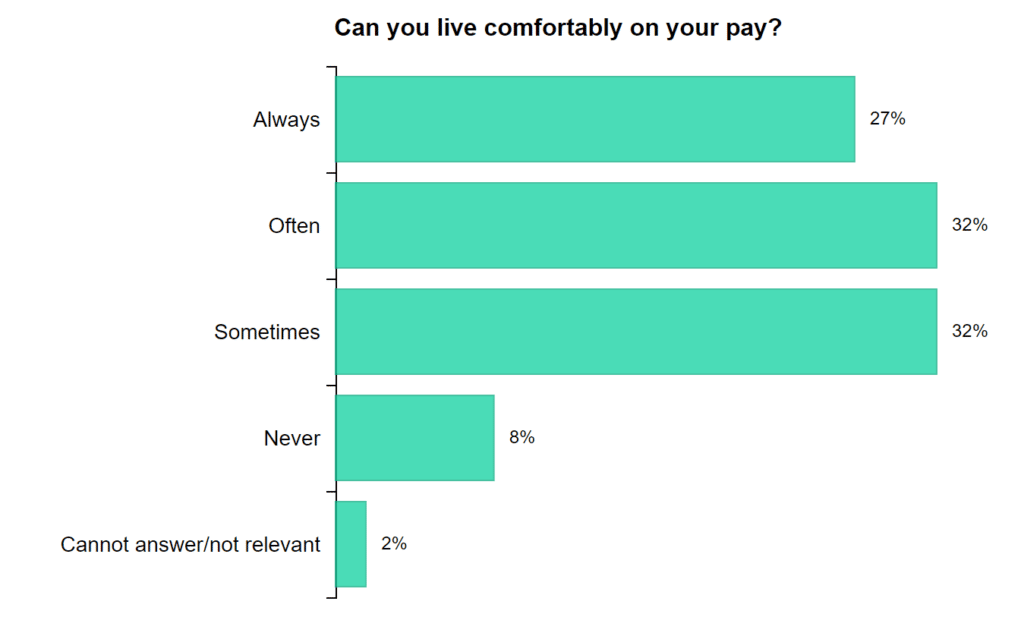
Teachers have very different levels of comfort on their pay. But from this we don’t know why, or if it is different by gender, age, family size, and so on.
Hence, we are going to start splitting out some further characteristics to see difference.
Another theory we will be investigating is whether teachers tend to be a lower or higher-earning spouse. If they are lower-earner, does that make it easier for them to leave? Or, if they are the higher-earner, does that mean we retain people who really want to leave the profession (and maybe even should because they have low morale and low performance), but feel trapped?
Great questions, and your best answers, will mean arguments made by policymakers can be tested, and can be challenged if needed.
6. As ever, we learned that you really love our daily tips, so here are the links for last week:
Why you should stay home when you are sick!
Engelmann and low-ability swimming
Cognitive load theory to plan a lesson
How to get kids to remember vocabulary
14,000-word read on curriculum
Right folks – over and out for another week…
In the meantime, please keep sharing what we are doing with colleagues so they can sign up too.
We’ve a powerpoint slide (with script), a PDF, and a black-and-white one-pager to help out.
**
Enjoyed this post and want to join our Teacher Tapp panel?
Sign up via the iPhone App Store or the Android App Store.
You can also check out more at www.teachertapp.co.uk


